Automatic Discovery and Catalog Server Nodes
In this module, you will learn about RackHD’s discovery, catalog and poller functionality by using the simulated virtual nodes created by Infrasim.
- Discovery: RackHD can automatically discover a node that attempts to do PXE boot on the network that RackHD is monitoring.
- Catalog: RackHD can capture the nodes’ attributes and capabilities.
- Poller: RackHD can periodically capture nodes’ telemetry data from the hardware interfaces.
Discovery
The infrsim/default.yml file (dir: RackHD/example) is used to defined the virutal node’s configuration. This demo uses an emulated quanta_d52 vnode. If you want to learn more about InfraSIM, you can go to https://github.com/InfraSIM.
UltraVNC Viewer is used to show the console of vnode. In this environment, the vnode console will be availabe on the rackhd_southbound network on port 5901.
- Start up a vnode
To start a vnode, the follwing command should be run from the Rackhd/example/infrasim direcotry.
sudo docker-compose up -d
You can execute command on host to check whether quanta_d51 vnode is up successfully. If the status of quanta_d51 vnode is running, quanta_d51 is up successfully.
sudo docker-compose ps
Once the virutual node is up, you can connect to it via a vnc viewer on port 5901. You first need to look at the log output to find the ip address of the bridge, br0, the virtual node is connected to.
sudo docker-compose logs
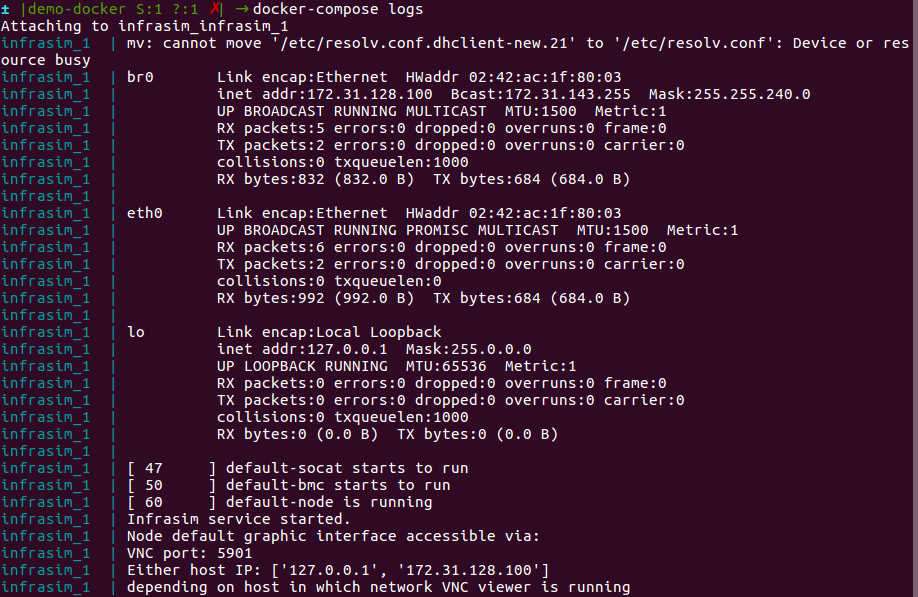
You can find the vnode’s ip&port is 172.31.128.100:5901. And you can use the vncviewer to connect this node. There are two scenes. - If your vncviewer tool and docker host are the same local network. You can connect the vnode using vncviewer tool directly. - If not, eg: your docker host is a remote machine with ubuntu system, and the vncviewer is installed in the local windows machine yte vncviewer is installed in the local windows machine. Please follow the three steps:
First, install vnc4server in your docker host (suppose its ip is 1.2.3.4). eg: install vnc4server in ubuntu 14.04 OS: sudo apt-get install vnc4server. Second, run vnodeDiscovery.sh script in your docker host, you can find the mapping port.
#/bin/bash -x
HOST_IP=`ifconfig eth0 | grep "inet addr" | awk 'BEGIN{FS=" "}{print $2}' | awk 'BEGIN{FS=":"}{print $2}'`
echo "Host eth0 IP is $HOST_IP"

for i in {2..255}
do
    NUMBER=$i
    IPADDR="172.31.128.$NUMBER"
    PORTNUM=`expr 28000 + $NUMBER`
    sudo iptables -P INPUT ACCEPT
    sudo iptables -P FORWARD ACCEPT
    sudo sysctl net.ipv4.ip_forward=1 > /dev/null
    sudo iptables -A PREROUTING -t nat -p tcp -d $HOST_IP --dport $PORTNUM -j DNAT --to $IPADDR:5901
    sudo iptables -t nat -A POSTROUTING -d $IPADDR -p tcp --dport 5901 -j MASQUERADE
    echo "Setting VNC port $PORTNUM for IP $IPADDR"
done
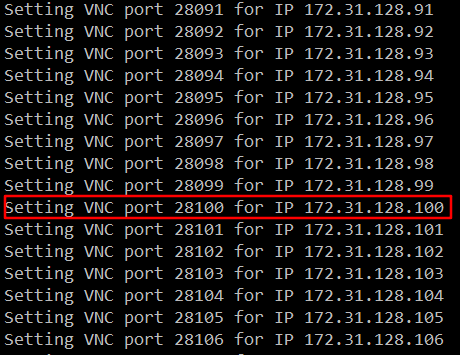
Third, use vncviewer tool to connect the vnode using the vnc server address 1.2.3.4:28100. Vncviewer download address: http://www.uvnc.com/downloads/ultravnc.html
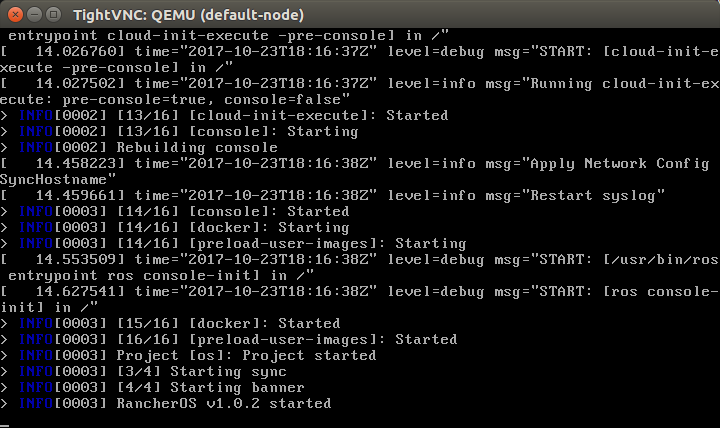
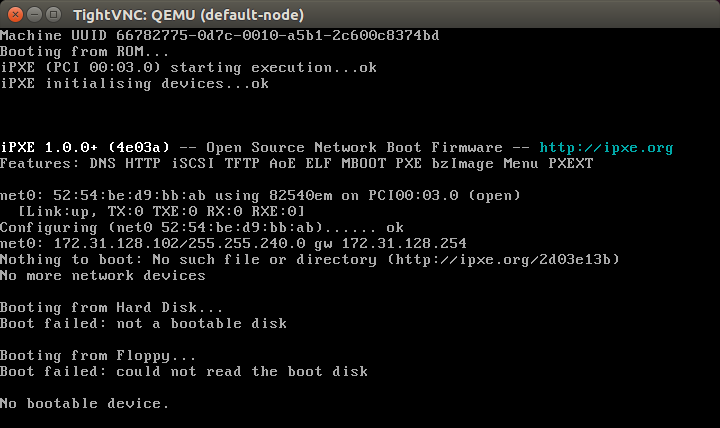
- The vNode console will pause for about 1 minute while Rackhd catalogs the vnode information. The vNode will reboot after cataloging finishes. This reboot indicates that the discovery workflow is completed.
4.Retrieve the nodes by typing the following RackHD API to discover the node.
curl localhost:9090/api/2.0/nodes | jq '.'
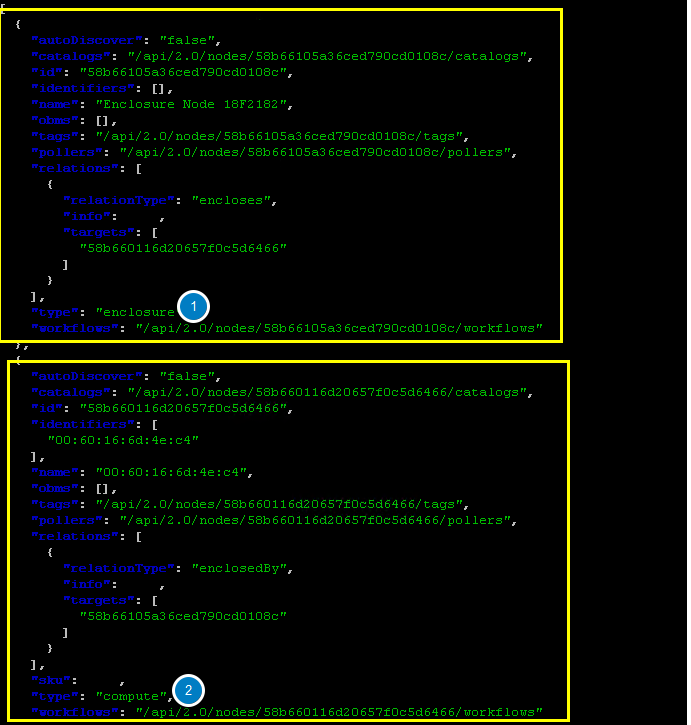
You can see one or more vnodes whose type is “enclosure” or “compute”.
NodeId
NodeId is the unique Identity of a node in RackHD. List all the compute type nodes being discovered on the rackhd-server SSH console by typing the following command. Append “?type=compute” as a query string.
You will focus on compute type nodes in this module
curl 127.0.0.1:9090/api/2.0/nodes?type=compute | jq '.'
In the following json output, the compute node ID is 58b660116d20657f0c5d6466. You will take it as a variable named <node_id> in the following module.
Note: The node_id varies for different nodes. Even for the same node, the Node ID changes if the RackHD database is being cleaned and the node rediscovered.
Do not use the example 58b660116d20657f0c5d6466 in your vLab. Use the displayed Node ID in your lab.
Retrieve Catalogs
Catalogs are described as the following:
- Free form data structures with information about the nodes
- Pluggable mechanisms for adding new catalogers for additional data
- JSON documents stored in MongoDB
Examples of catalog sources include the following:
- Drive smart information
- DriveId catalog including system identified drive information
- DMI from dmidecode command
- OHAI aggregate of different stats in more friendly JSON format
- IPMI information gets per ipmitool over KCS channel LAN information
- FRU, SEL, SDR, MC information
- lsscsi, lspci, lshw commands output
- Raid information can be got via storcli/perccli tool
- Dell computers provide some catalogs retrieved from RACADM tool
- LLDP
Specify The Catalogs Source
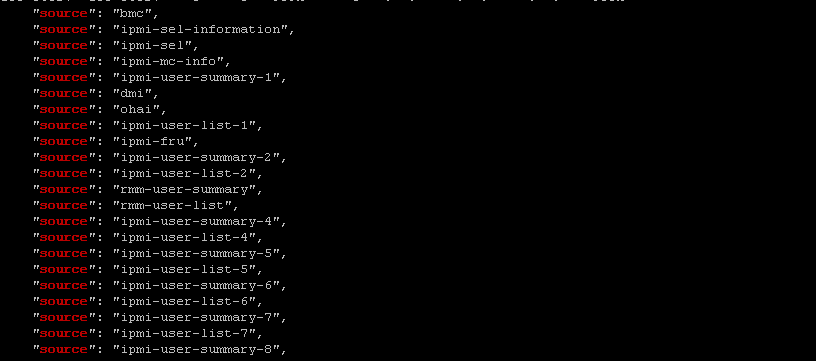
- To view the sources where the catalogs data was retrieved from, type the following command.
Note: the <node_id> is the Node-ID retrieved from Step 3.
curl 127.0.0.1:9090/api/2.0/nodes/<node_id>/catalogs/ | jq '.' | grep source
- Select one of the sources you are interested in, and then append to the command. For example, the following example use ipmi-fru
curl 127.0.0.1:9090/api/2.0/nodes/<node_id>/catalogs/ipmi-fru | jq '.'
or “driveId” as example
curl 127.0.0.1:9090/api/2.0/nodes/<node_id>/catalogs/driveId | jq '.'
Retrieve Pollers
What’s Poller
- The pollers API provides functionality for periodic collection of IPMI and SNMP data.
- IPMI Pollers can be standalone or can be associated with a node. When an IPMI poller is associated with a node, it will attempt to use that node’s IPMI OBM settings in order to communicate with the BMC. Otherwise, the poller must be manually configured with that node’s IPMI settings.
- SNMP pollers can be standalone or associated with a node. When an SNMP poller is associated with a node, it attempts to use that node’s snmpSettings in order to communicate via SNMP. Otherwise, the poller must be manually configured with that node’s SNMP settings.
Examples of Telemetry
- Switches Switch CPU, Memory
- Port status
- Port utilization
- Arbitrary MIB gathering capable
- PDU Socket status
- Arbitrary MIB gathering capable
- IPMI Sensors (SDR)
- Power status
Retrieve Pollers
- On rackhd-server,list the active pollers which by default run in the background, by typing the following command.
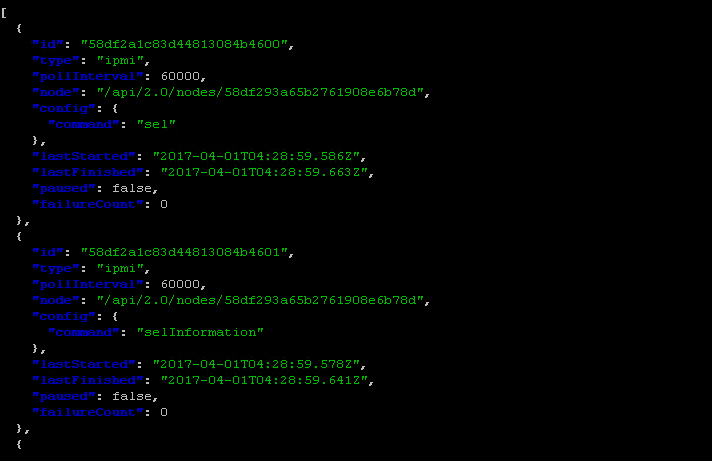
curl 127.0.0.1:9090/api/2.0/pollers| jq '.'
Below is a definition of each field in the example output below:
- “id” is the poller’s id. Denote it as <poller_id>. you will refer to later.
- “type” means it is an IPMI poller or SNMP poller, and so on.
- “pollInternal” is the interval for the frequency that RackHD polls that data. The time is the milliseconds to wait between polls.
- “node” is the target node of the poller that the data comes from.
- “command” is the kind of IPMI command that this poller is issued.
Note: Record listed below is an example. The output on your screen will look similar with different data.
{
 "id": "58b66105a36ced790cd01091",
 "type": "ipmi",
 "pollInterval": 30000,
 "node": "/api/2.0/nodes/58b660116d20657f0c5d6466",
 "config": {
 "command": "sdr"
 },
 "lastStarted": "2017-03-01T06:22:35.417Z",
 "lastFinished": "2017-03-01T06:22:55.241Z",
 "paused": false,
 "failureCount": 0
}
- Show the poller data, by typing the following command.
curl 127.0.0.1:9090/api/2.0/pollers/<poller_id>/data | jq '.'
- Change the interval of a poller, by typing the following command.
curl -X PATCH -H 'Content-Type: application/json' -d '{"pollInterval":15000}' 127.0.0.1:9090/api/2.0/pollers/<poller_id>